Introduction: Why GDP Rankings Matter
Every year, the world pays close attention to GDP rankings—the list of countries arranged by the size of their economies. For governments, investors, businesses, and ordinary citizens, GDP (Gross Domestic Product) is more than just a number. It reflects economic power, living standards, investment opportunities, and future growth potential.
But what exactly does GDP mean? How are countries ranked, and why do these rankings shift over time? More importantly, what do these numbers mean for our daily lives?
In this article, we’ll break down what GDP is, how it’s measured, and what the global rankings tell us about the world economy.
What is GDP?
GDP (Gross Domestic Product) is the total value of goods and services produced within a country’s borders in a given year. It’s one of the most common measures of a country’s economic size and strength.
Key Components of GDP (The Expenditure Approach):
Consumption (C): Household spending on goods and services.
Investment (I): Business investments in factories, machines, and housing.
Government Spending (G): Expenditures by government on defense, education, healthcare, etc.
Net Exports (NX): Exports minus imports.
Formula:
𝐺
𝐷
𝑃
=
𝐶
+
𝐼
+
𝐺
+
(
𝑋
−
𝑀
)
GDP=C+I+G+(X−M)
Types of GDP Measurements
To understand rankings, you must know the two main ways GDP is measured:
1. Nominal GDP
Calculated using current market prices in US dollars.
Shows the size of economies in absolute terms.
Larger economies like the US and China dominate nominal GDP rankings.
2. GDP (PPP) – Purchasing Power Parity
Adjusts for differences in cost of living and inflation.
Provides a more accurate measure of real living standards.
Countries like India and Indonesia rank higher in PPP terms than in nominal GDP.
Why GDP Rankings Change
Global GDP rankings shift due to several factors:
Economic Growth Rates – Fast-growing economies like India or Vietnam climb rankings.
Currency Fluctuations – A weaker local currency reduces nominal GDP in USD.
Inflation & Recession – High inflation or economic slowdown lowers rankings.
Demographics – Larger populations can increase output and GDP in PPP.
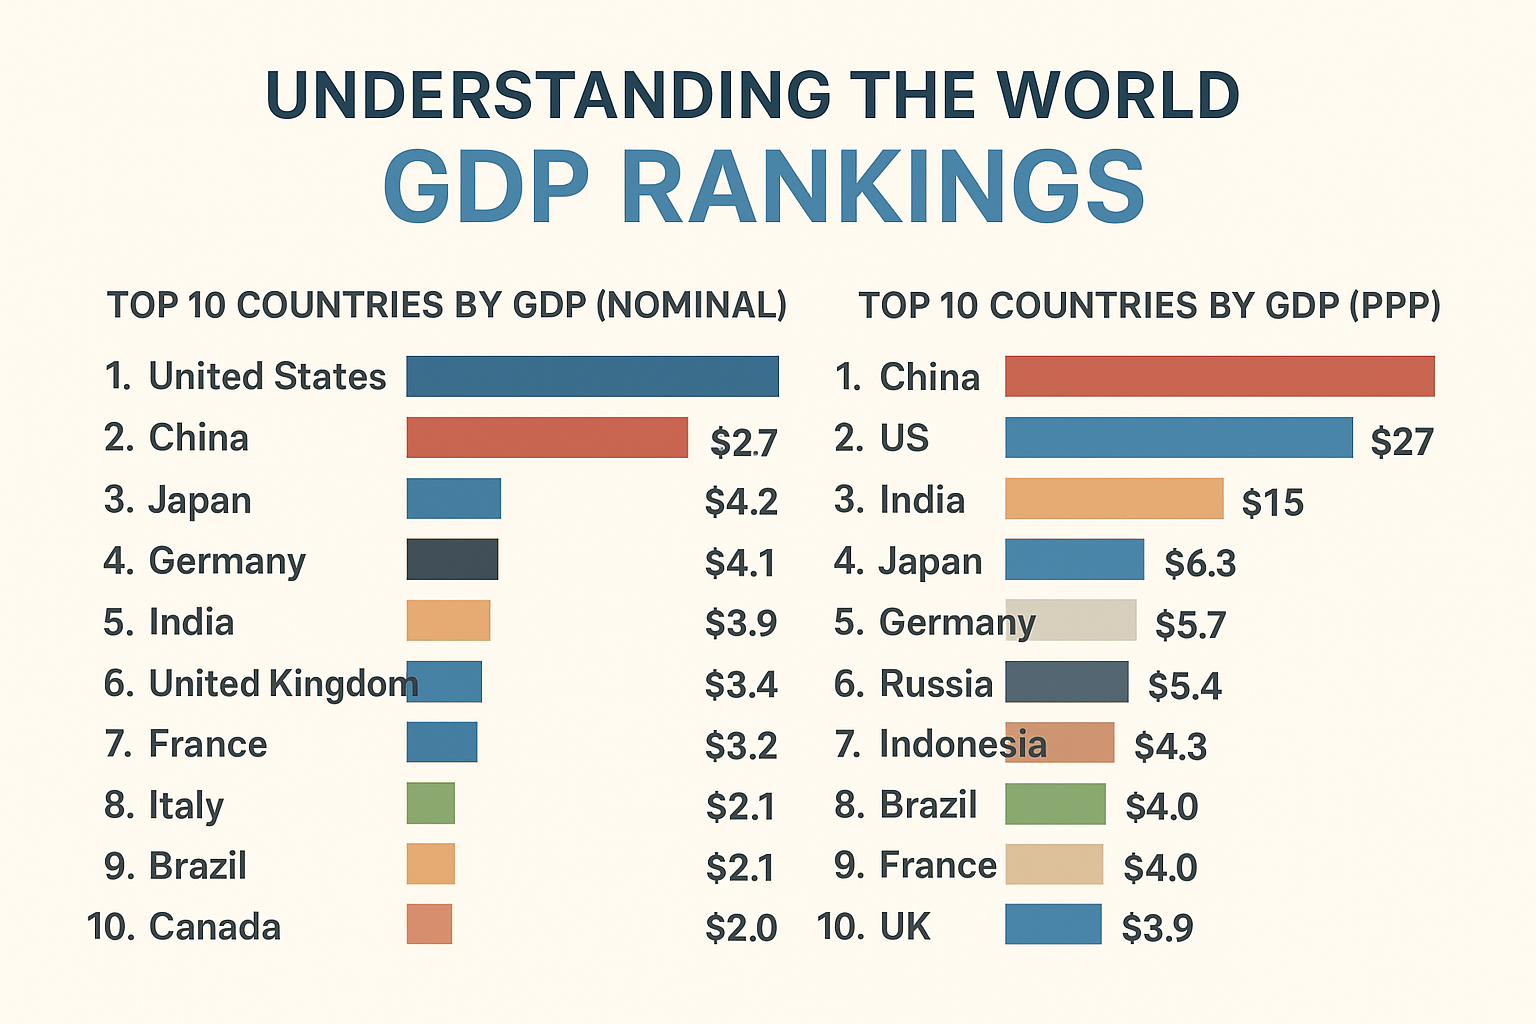
Current Top 10 Economies in the World (Nominal GDP)
(Note: Rankings may vary slightly each year. These are general 2024 estimates)
United States – ~$27 trillion
China – ~$17.7 trillion
Japan – ~$4.2 trillion
Germany – ~$4.1 trillion
India – ~$3.9 trillion
United Kingdom – ~$3.4 trillion
France – ~$3.2 trillion
Italy – ~$2.1 trillion
Brazil – ~$2.1 trillion
Canada – ~$2.0 trillion
Top 10 Economies by GDP (PPP)
This ranking looks very different because it reflects real purchasing power:
China – ~$34 trillion
United States – ~$27 trillion
India – ~$15 trillion
Japan – ~$6.3 trillion
Germany – ~$5.7 trillion
Russia – ~$5.4 trillion
Indonesia – ~$4.3 trillion
Brazil – ~$4.0 trillion
France – ~$4.0 trillion
United Kingdom – ~$3.9 trillion
What GDP Rankings Reveal About the World Economy
US vs China Rivalry
The US leads in nominal GDP, but China dominates in PPP.
This reflects China’s lower costs of living and massive domestic output.
India’s Rise
India is now a top 5 global economy in nominal GDP and top 3 in PPP.
Its large population and growing services sector fuel this rise.
Europe’s Position
Germany, UK, and France remain strong but face slower growth.
Aging populations and energy challenges affect their future rankings.
Emerging Economies
Countries like Indonesia, Turkey, Nigeria, and Mexico are rising fast.
By 2050, some of these could overtake traditional European powers.
Limitations of GDP Rankings
While GDP is important, it doesn’t tell the whole story.
Income Inequality: A country can have a high GDP but still have millions living in poverty.
Quality of Life: GDP doesn’t measure happiness, health, or education.
Environmental Impact: Rapid GDP growth often comes at the cost of pollution and resource depletion.
Informal Economy: Many developing nations have large unrecorded economies not captured in GDP data.
How GDP Affects Daily Life
GDP rankings are not just for economists—they matter for ordinary people too.
Higher GDP = More job opportunities (stronger industries, investment).
Low GDP growth = Rising unemployment & weaker wages.
Strong GDP countries attract foreign investment → more infrastructure and better services.
Tourism & global reputation also improve with stronger economies.
Future Trends in Global GDP Rankings
Experts predict major shifts in the next 20–30 years.
China is expected to surpass the US in nominal GDP by the 2030s.
India may rise to #3 globally as its middle class expands.
Africa’s economies (Nigeria, Egypt, South Africa) are projected to grow due to demographics.
Technology-driven economies (South Korea, Singapore) will keep climbing.
Practical Takeaways for Readers
Investors: GDP rankings signal where opportunities may lie (e.g., India’s tech market, Africa’s growth).
Students & Professionals: Understanding GDP helps in career choices—finance, trade, technology sectors benefit most from strong economies.
Everyday Citizens: Rising GDP can improve wages, infrastructure, and services—but only if wealth is distributed fairly.
Conclusion: Beyond Numbers
GDP rankings are more than just global scoreboards. They reflect economic strength, political influence, and quality of life potential. Understanding how GDP is calculated, why rankings shift, and what they mean for the future allows us to see the bigger picture of our interconnected world.
While the US and China dominate today, the future is multipolar, with India, Africa, and Southeast Asia set to rise. For individuals, businesses, and nations alike, keeping an eye on GDP rankings is key to navigating tomorrow’s economic landscape.